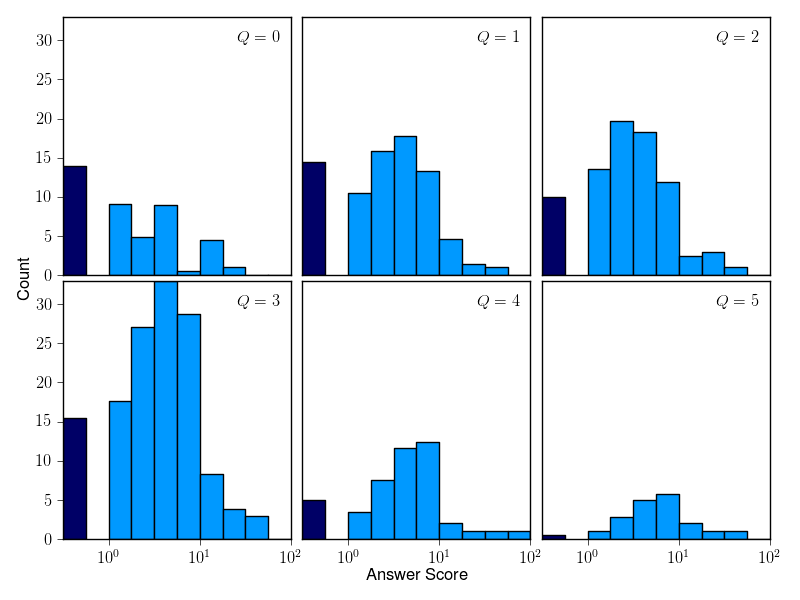
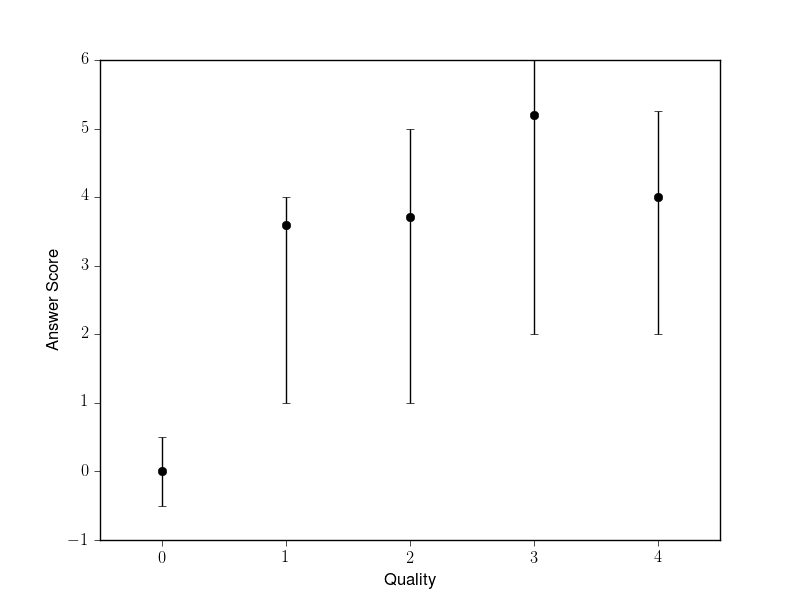
There has been a general sense among a number of users, myself included, that simplistic, almost throwaway answers can get very high scores, while thoroughly researched, high-level answers can languish with few to no votes. See the discussion here for example.
To what extent is this backed by data?
I set out to answer this question, if not once and for all then at least to begin to shed some light on it. To that extend I wrote a very minimal Python script, uploaded to GitHub, for crunching some numbers and making some plots.1
The script needs two pieces of input to run. First, it expects a local copy of the CSV file associated with this Data Explorer query. Simply run it with your user ID and click the "Download CSV" link. The other requirement is much more labor intensive: A file with the post IDs of all your answers and a "quality score" for each. For my purposes, I used a 6-point scale:
0. It might actually be beneficial for this answer to be deleted.
1. Just a quick answer to an easy question, one that required essentially no work.
2. A not-so-great answer that was nonetheless not entirely trivial.
3. A run-of-the-mill good answer.
4. A solid, well-researched answer that provides thorough insight into the problem at hand.
5. An outstanding answer, the kind about which songs will be sung many generations hence.
This is really unavoidable for my scheme. In order to measure the correlation between "quality" and score, we need to actually have "quality" numbers on hand. I did my best to rate all my 400 or so answers to date, trying not to let the answer's votes sway my feelings about its "quality" one way or the other. It took the better part of a lazy afternoon to go through them all, in case anyone wants a time estimate for doing this themselves.
Some plots and conclusions are given an an answer below. However, this is just the analysis of my own opinion of my own answers. More data would be great, so I encourage others to use the tools mentioned above (or their own tools) for analyzing this sort of data.2
Please feel free to post your own data or your alternate analysis of my data as answers here.
1Bug reports, feature requests, and support inquiries welcome. I'll try my best, but I cannot guarantee a timely response.
2My personal data dump and self-rankings are included in the repository, in case you want to jump right in and play with data without ranking answers. In particular, the query returns more information than the script currently uses, such as dates and question scores, so a better analysis can certainly be done.


