Given the COVID-19 pandemic forced many professionals and students to work and learn from home, I was curious to see how the site is doing regarding traffic and activity. Are we seeing more traffic, or less? Is there anything that we should do in response to it?
-
3$\begingroup$ According to this blog post by Ben Popper, Director of Content, there's been a surge of traffic on the network, but he doesn't mention Physics.SE. Prashanth Chandrasekar, the CEO, also mentioned the increase in traffic in his quarterly post. Also see meta.stackexchange.com/q/347610/334566 $\endgroup$– PM 2RingCommented May 8, 2020 at 23:43
1 Answer
I had a brief look at the analytics page, and there's definitely a curious pattern.
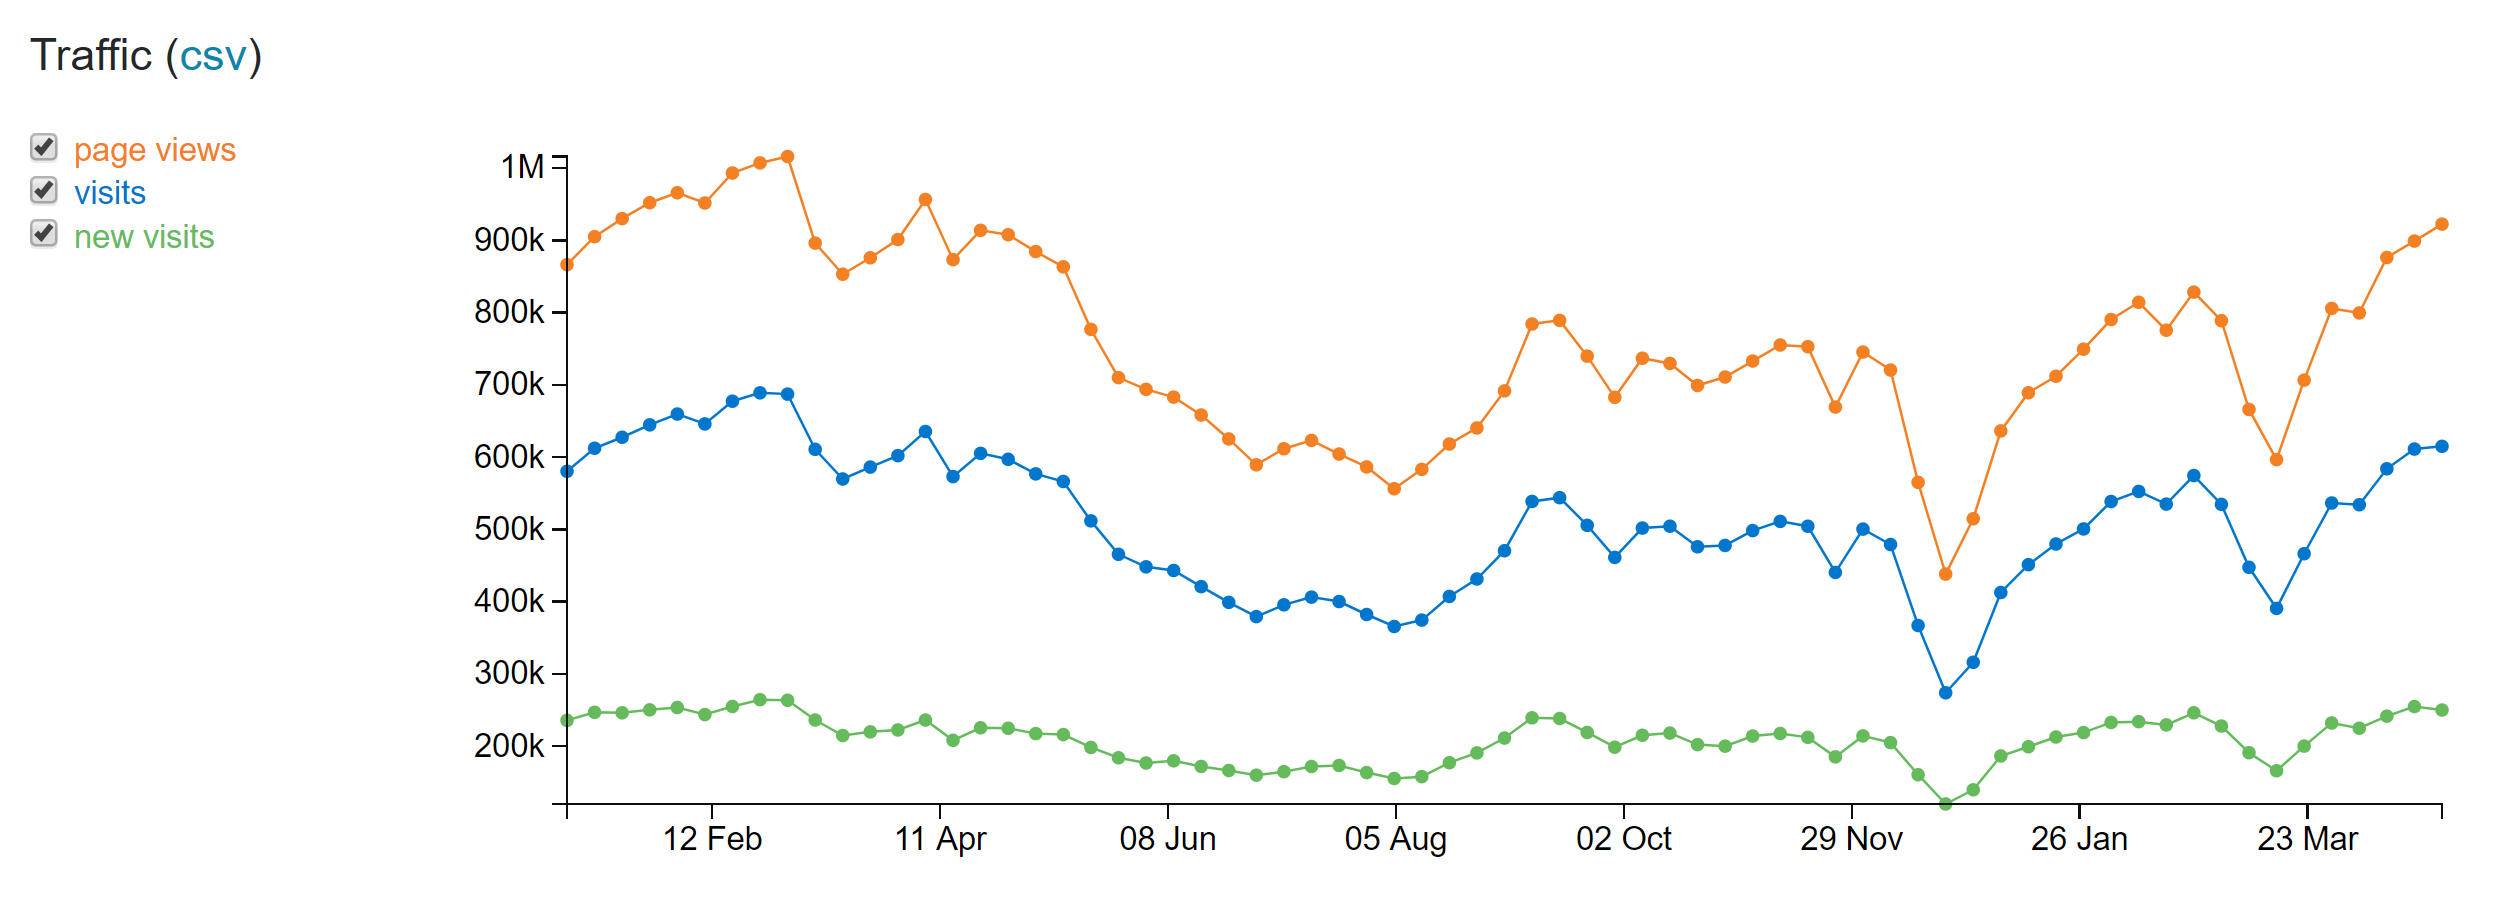
Bare traffic does not show any noticeable changes
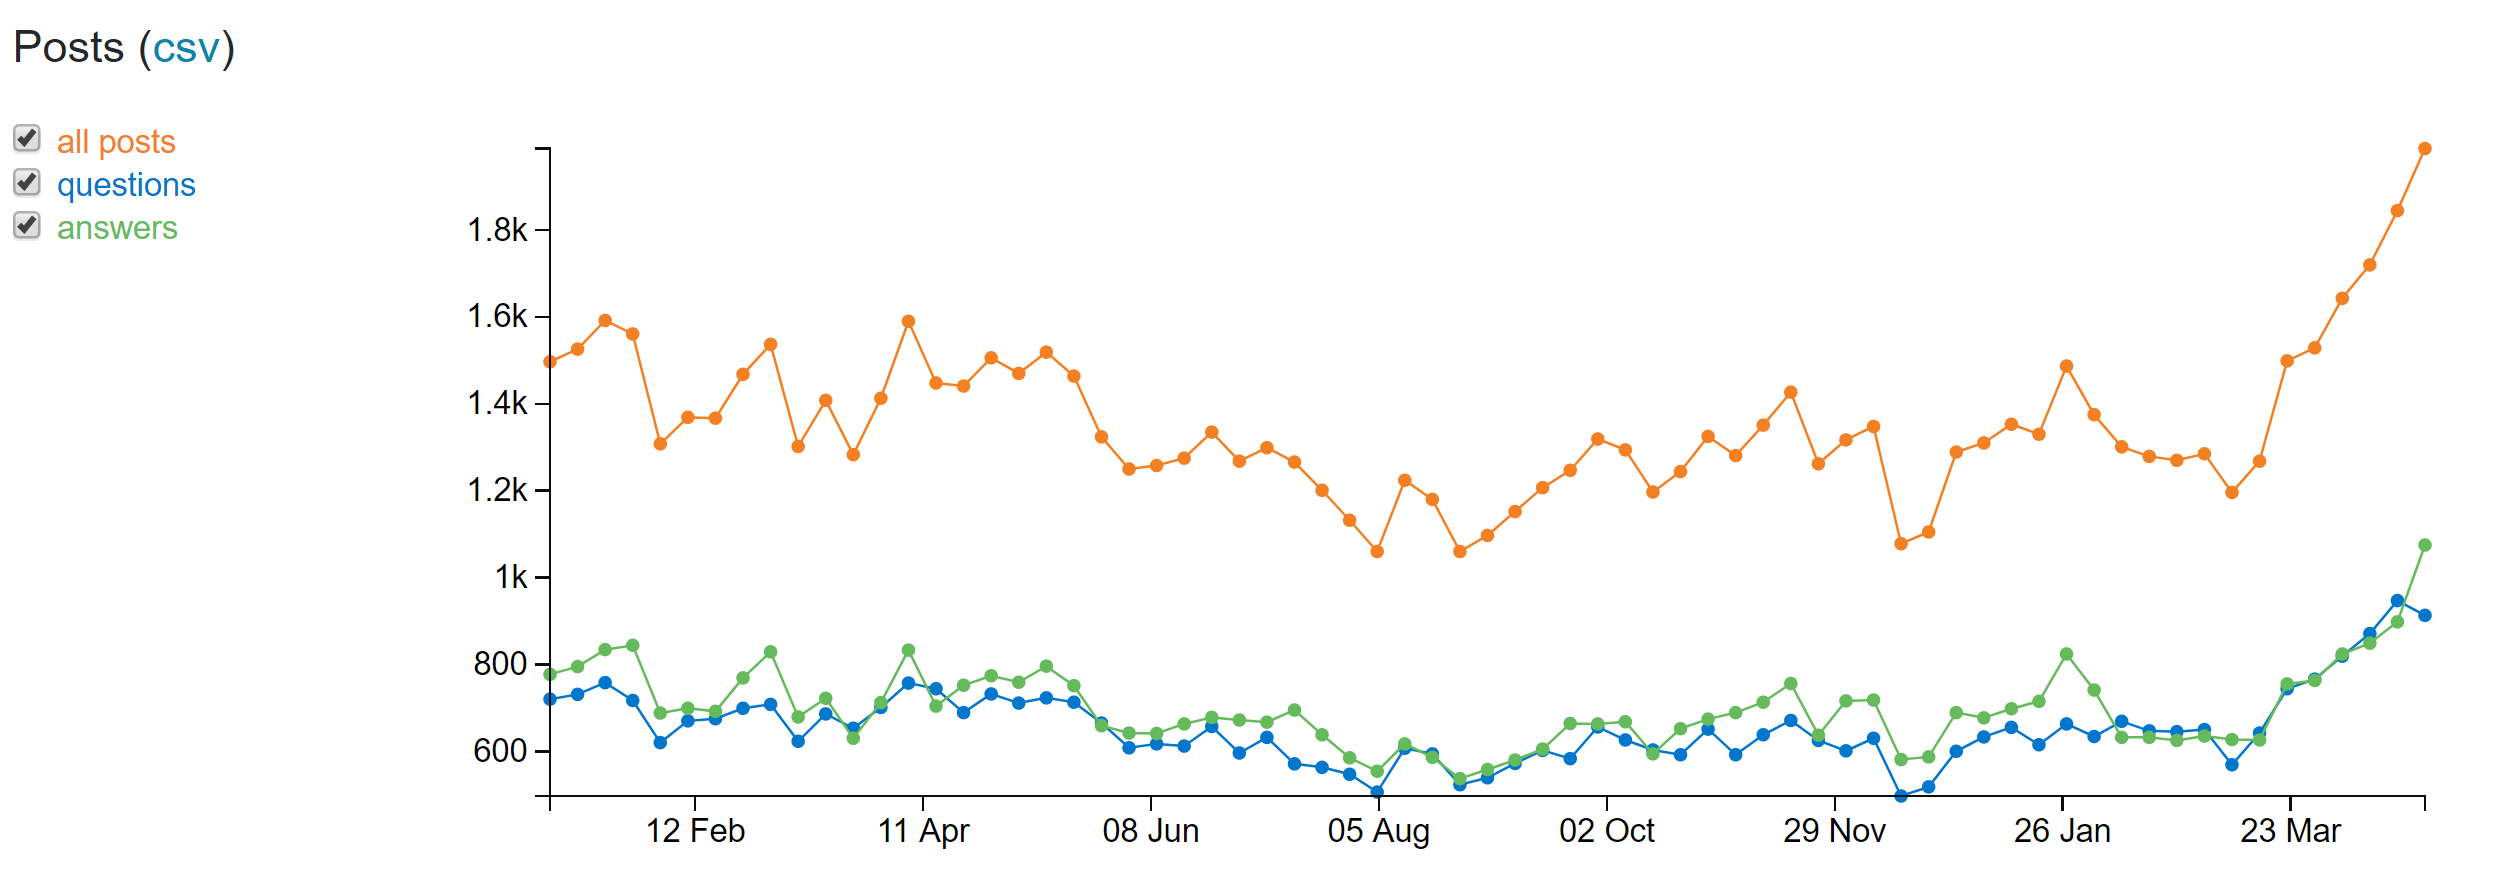
(weekly plot from 1 January 2019 onwards), but posts seem to be up by a factor of ~70% with a linear rise starting in mid-March:
As a follow-up question, for anybody with the time and inclination: what tags are these new posts mostly being posted in? Does it show a broad overall increase of activity, or are certain aspects (say, homework, or basic newtonian kinematics, or anything else) responsible for the lion's share of this growth?
-
1$\begingroup$ What do you mean by "does not show any noticeable changes"? To me, the COVID-19 dip looks like the (annual) Chistmas dip. Is there an annual March dip (semester end related)? $\endgroup$ Commented May 8, 2020 at 18:22
-
5$\begingroup$ It certainly feels like there are more homework-style question so yes indeed it would be nice to see if this is just my grumpy mood or it is real. $\endgroup$ Commented May 9, 2020 at 12:35
-
2$\begingroup$ @Peter Mortensen: This year's 25% March spring break dip is much deeper than usual, which is typically at most 10%. $\endgroup$– Qmechanic ModCommented May 9, 2020 at 13:21
-
3


